Research Summary. The U.S. financial advisory industry continues to expand in both scale and complexity. SEC-registered investment advisers managed USD 144.6 trillion in regulatory assets under management (RAUM) in 2024, a 12.6% increase from the previous year and the highest level ever recorded. The total number of advisers, clients, and non-clerical employees also reached all-time highs.
Demand remains strong across high-net-worth households, mass-affluent investors, and retirement savers. At the same time, firms continue adopting technology, hybrid advice models, and data-driven planning tools, while regulators emphasize fee transparency, communication oversight, and compliance controls.
This guide provides updated 2026 statistics on advisor counts, demographics, compensation, market size, and the trends reshaping the profession.
Key Statistics
- SEC-registered investment advisers oversaw USD 144.6 trillion in RAUM in 2024, up from USD 128.4 trillion in 2023. (source)
- 15,870 SEC-registered investment advisers served 68.4 million clients and employed 1,032,455 non-clerical staff in 2024. (source)
- The U.S. had approximately 326,000 personal financial advisor jobs in 2024, with a median annual wage of USD 102,140. (source)
- Employment of financial advisors is projected to grow 10% from 2024–2034, with about 24,100 openings per year. (source)
- Broader industry definitions estimate 240,000 to 370,000 financial advisors nationwide across RIAs, broker-dealers, hybrids, and self-employed professionals. (source)
- Occupational data show that most advisors are men in their 40s, with the majority identifying as White, although gender and racial diversity continue to grow slowly. (source)
- Global financial advisory assets and revenues continue expanding through 2030, driven by rising household wealth, hybrid advice models, and technology adoption. (source)
Overview of the Financial Advisory Industry
Industry Growth
- Assets managed by SEC-registered investment advisers reached USD 144.6 trillion in 2024, reflecting a 12.6% YoY increase. (source)
- Worldwide financial advisory assets under management and revenue are projected to continue climbing through 2030, driven by digital adoption and demand for hybrid human-plus-technology models. (source)
- The U.S. financial advisory services market is projected to reach USD 146.8 billion by 2032. (source)
Key Growth Drivers
- Rising Demand Across Wealth Segments: High-net-worth, mass-affluent, and retirement households all continue seeking comprehensive financial planning.
- Technology & AI Adoption: Firms increasingly use digital dashboards, analytics, and automation to enhance efficiency and personalization.
- Digital & Hybrid Advice Models: Clients expect mobile access, ongoing updates, and flexible advisor communication.
- Demographic & Retirement Pressures: An aging population, longer retirements, and multi-trillion-dollar wealth transfers support strong long-term demand.
- Regulatory Developments: Firms report growing oversight related to fee disclosure, communication documentation, and off-channel communication compliance.
Number of Advisors

- Total Number of Advisors: Approximately 326,000 personal financial advisor jobs were reported in 2024. (BLS) (source)
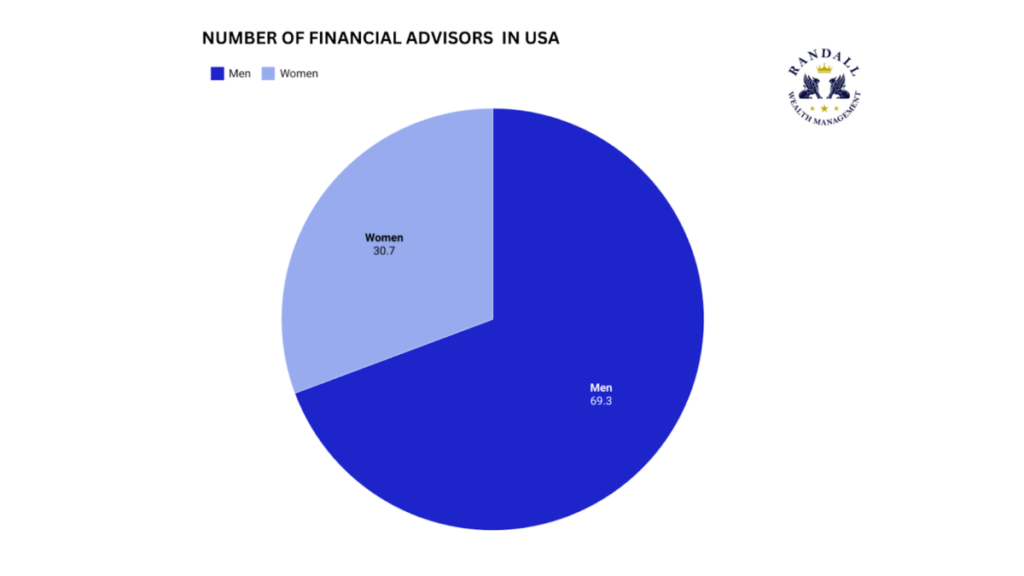
- Gender Distribution: Roughly 70% men and 30% women across advisor roles. (DataUSA / SmartAsset) (source)
- Average Age: Mid-40s, with over 60% of advisors aged 40 or older. (source)
- Job Growth Projection: Employment expected to rise 10% from 2024 to 2034, with 24,100 annual openings. (source)
Market Size
According to Mordor Intelligence, the North American financial advisory services market, which includes the USA, is expected to reach USD 63.90 billion in 2024 and grow at a Compound Annual Growth Rate (CAGR) of 8.12% to reach USD 94.41 billion by 2029. (source)

Demographics of Financial Advisors
Age Distribution of Financial Advisors
The average finance advisor age is 44 years old.
40+ Years:
- Represents the largest segment, with 61% of financial advisors being over 40 years old. (source)
- Indicates a mature workforce with significant experience in the industry.
30-40 Years:
- Comprises 30% of the workforce. (source)
- This group is likely in mid-career, balancing experience with growth opportunities.
20-30 Years:
- The smallest segment, accounting for 9% of financial advisors. (source)
- Represents young professionals at the beginning of their careers, bringing fresh perspectives to the industry.
Analysis of Average Finance Advisor Age by Ethnicity and Gender

- Unknown Ethnicity: Male advisors average around 41 years old, while female advisors are significantly older, averaging around 46 years. (source)
- White: Both male and female advisors average around 44 years old. (source)
- Black or African American: Male advisors average around 42 years, while female advisors are slightly younger, averaging around 44 years. (source)
- Asian: Male advisors average around 40 years, with female advisors slightly older at around 43 years. (source)
- Hispanic or Latino: Male advisors average around 41 years, with female advisors averaging around 45 years. (source)
Gender Distribution of Financial Advisors
- Male: Male finance advisors constitute 72.3% of the workforce, indicating a significant gender disparity in the profession. (source)
- Female: Female finance advisors make up 27.7% of the workforce. (source)
Analysis of Finance Advisor Gender Pay Gap
- Male Income: The average income for male finance advisors is $64,280. (source)
- Female Income: The average income for female finance advisors is $53,971. (source)
- Pay Discrepancy: Women earn 84 cents for every dollar earned by men. (source)
Finance Advisor Gender Ratio Over Time
- Male Representation: Consistently dominant, ranging around 72.3% from 2010 to 2021 years. (source)
- Female Representation: Steadily around 27.7%, showing little change over the observed period (2010-2021). (source)
Race Distribution
- White: The most common ethnicity, making up 72.1% of all finance advisors. (source)
- Hispanic or Latino: Comprising 9.5% of finance advisors. (source)
- Asian: Representing 8.3% of the workforce. (source)
- Black or African American: Accounting for 5.6%. (source)
- Unknown: Making up 4.4%. (source)
- American Indian and Alaska Native: The smallest group at 0.1%. (source)
This distribution highlights the predominance of White individuals in the profession, with other ethnic groups being significantly underrepresented. Efforts to diversify the industry could increase inclusivity and better reflect the diverse client base financial advisors serve.
Ethnicity Distribution
- Hispanic: 9.14% of personal financial advisors were Hispanic. (source)
- Non-Hispanic: 90.9% of personal financial advisors were non-Hispanic. (source)
Detailed Hispanic Ethnicity Distribution

- Mexican: The largest subgroup, accounting for 66% of Hispanic personal financial advisors. (source)
- Puerto Rican: Representing 22.3% of the Hispanic advisor population. (source)
- Cuban: Comprising 11.6% of Hispanic financial advisors. (source)
- Other Notable Groups:
- Colombian: 5.49%
- Salvadoran: 4.16%
- Dominican: 3.79%
- Ecuadorian: 3.55%
- Spaniard: 4.64%
- Venezuelan: 2.98%
- Argentinean: 1.72%
- Peruvian: 1.24%
- Guatemalan: 1.09%
- Honduran: 1.06%
- Chilean: 0.86%
Analysis of Finance Advisor Race and Ethnicity Over Time
The racial diversity trends among finance advisors from 2010 to 2021:
- White: Dominates the profession, consistently comprising around 72-75% of finance advisors. There has been a slight but steady decrease in their representation over the years. (source)
Whites remain the predominant group, although their percentage has slightly decreased.
- Hispanic or Latino: Has seen a gradual increase, now making up approximately 9.5% of the workforce. (source)
Both Hispanic or Latino and Asian finance advisors have seen modest but steady growth in their numbers.
- Asian: Also shows a slow rise in representation, currently around 8.3%. (source)
- Black or African American: Their representation has remained relatively stable, hovering around 5.6%. (source)
The percentage of Black or African American advisors has not significantly changed over the observed period.
Financial Advisor Wage Gap by Race and Ethnicity
- Asian: Finance advisors of Asian descent have the highest average salary at approximately $67,000. (source)
Asian finance advisors top the salary chart, indicating potentially better access to higher-paying opportunities or roles. - White: White finance advisors earn an average salary of around $65,000.(source)
- Hispanic or Latino: Hispanic or Latino advisors earn an average of about $63,000. (source)
Hispanic or Latino and those of unknown ethnicity fall in the mid-range of the salary spectrum. - Unknown: Advisors with unspecified ethnicity have an average salary of around $64,000. (source)
- Black or African American: Black or African American finance advisors have the lowest average salary at $57,257. (source)
There is a noticeable wage gap, with Black or African American advisors earning significantly less than their Asian and White counterparts.
Education and Certification

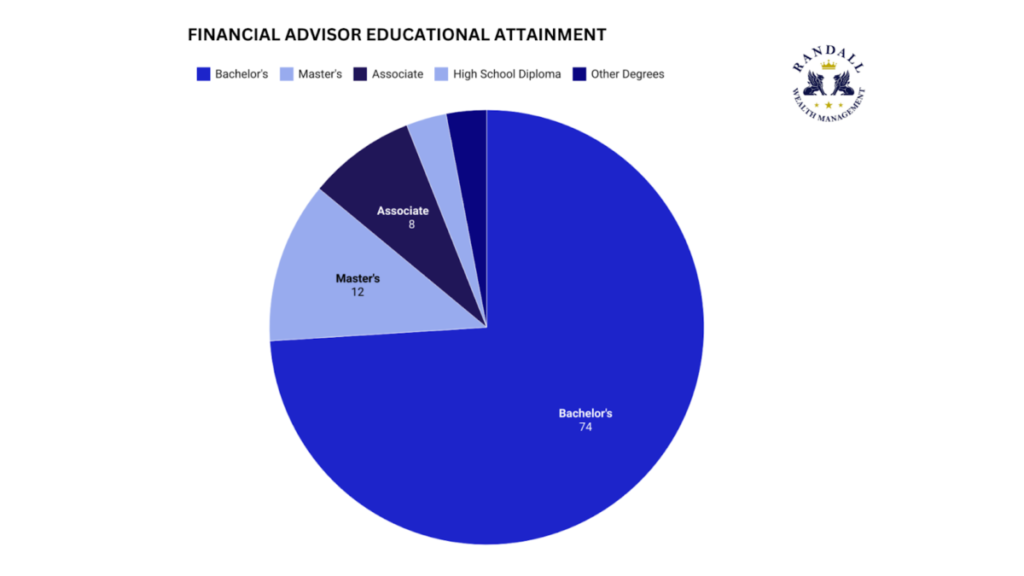
- Bachelor’s Degree: The most common degree, held by 74% of finance advisors. (source)
This indicates that a majority of professionals in the field have completed undergraduate studies, which is often considered the minimum requirement for entry-level positions. - Master’s Degree: Held by 12% of finance advisors. (source)
Reflects a significant portion of advisors pursuing advanced education to enhance their expertise and career prospects. - Associate Degree: Earned by 8% of advisors. (source)
Suggests that some professionals enter the field with a two-year degree, possibly supplemented by certifications or work experience. - High School Diploma: Only 3% of finance advisors have this as their highest level of education. (source)
Highlights the limited opportunities available for those without post-secondary education in this profession. - Other Degrees: Also 3%, includes various other educational paths that may not fit into traditional degree categories. (source)
Finance Advisor Wage Gap By Degree Level
- Doctorate Degree: Finance advisors with a doctorate degree earn the highest salaries, averaging $81,827 annually. (source)
This suggests that advanced education significantly boosts earning potential in the finance advisory field. - Master’s Degree: Advisors holding a master’s degree have a median annual income of $74,942. (source)
This indicates a substantial income advantage over those with just a bachelor’s degree. - Bachelor’s Degree: Finance advisors with a bachelor’s degree earn a median salary of $68,144 annually. (source)
While lower than those with higher degrees, it still represents a solid earning potential for professionals with undergraduate qualifications.

Services Offered
Types of Services Provided by Financial Advisors
Investment Management:
- According to the U.S. Bureau of Labor Statistics, 63% of personal financial advisors work in securities, commodity contracts, and other financial investments and related activities (source).
Retirement Planning:
- In 2023, the median annual wage for personal financial advisors was $99,580 (source), reflecting the high value placed on their expertise in planning for retirement.
Estate Planning:
- Approximately 42,000 job openings for personal financial advisors are projected each year from 2022 to 2032, driven by the need for estate and other financial planning services (source).
Insurance Planning:
- Financial advisors in the insurance industry make up 3% of the workforce, indicating the importance of this service (source).
Financial Goal Setting:
- The projected 13% job growth rate for personal financial advisors from 2022 to 2032 highlights the increasing demand for comprehensive financial planning services (source).
Service Trends in Financial Advisory
Digital Transformation (Robo-advisors)
- The job growth for personal financial advisors is projected at 13% from 2022 to 2032, partly due to the integration of digital advisory services (source).
Holistic Financial Planning:
- A large proportion of financial advisors (63%) are involved in various financial investments and related activities, reflecting the demand for diverse financial planning services (source).
Focus on Retirement Planning:
The median annual wage of $99,580 for personal financial advisors underscores the value of expertise in retirement planning (source).
Employment and Salary Statistics
Employment Over Time and Wage Disparities in Financial Advisory
Wage Trends by Gender
- Men: The average annual wage for male financial advisors in 2022 was $193,000, with an estimated variance of approximately $8,607. This shows a significant upward trend over the years. (source)
- Women: Female financial advisors earned an average annual wage of $114,000 in 2022, with an estimated variance of approximately $8,724. While there is an upward trend, the wage growth for women lags behind that of men. (source)
Wage Growth
- Average Annual Wage: The overall average annual wage for personal financial advisors in 2022 was $168,465. This represents an average annual growth of 41% from 2014, where the average wage was $119,456. (source)
- Wage Gap: The wage gap between male and female financial advisors is substantial, with men earning an average of $79,000 more annually than women in 2022. (source)
Employment and Wage Trends for Financial Advisors by Location
Top Earning States in 2024:
- Connecticut: Average Wage – $217,864 (source)
This state offers the highest average annual wage for financial advisors, reflecting a strong demand for financial advisory services and a high cost of living. - New York: Average Wage – $215,466 (source)
New York, a major financial hub, provides lucrative opportunities for financial advisors, contributing to its high average wage. - New Jersey: Average Wage – $210,083(source)
Proximity to financial centers like New York City boosts the demand and earnings for financial advisors in New Jersey.
Wage Distribution
- Wage Gini: In 2022, personal financial advisors had a wage Gini coefficient of 0.451, which is lower than the national average of 0.478. (source)This indicates that wages are more evenly distributed among personal financial advisors compared to the overall labor force.
Salary Distribution
- $200k+ Category: A significant portion of personal financial advisors earn over $200,000 annually. (source)
- $10k-$50k Categories: These lower salary ranges have a smaller share of personal financial advisors compared to the overall labor force, indicating fewer advisors earn in these brackets. (source)
- $60k-$120k Categories: These mid-range salary brackets see a higher share of personal financial advisors, reflecting a more even distribution within these earnings compared to the overall labor force. (source)
References
Global Market Insights. (2023). Financial advisory services market size was valued at USD 85.1 billion in 2022 and is expected to expand at a CAGR of 5.5% between 2023 and 2032.
Retrieved from https://www.gminsights.com/industry-analysis/financial-advisory-services-market
Data USA. (2023). Personal financial advisors: Employment and wage measures. Retrieved from https://datausa.io/profile/soc/personal-financial-advisors
Mordor Intelligence. (2023). The North America financial advisory services market size in terms of revenue is expected to grow from USD 47.12 billion in 2024 to USD 66.27 billion by 2029.
Retrieved from https://www.mordorintelligence.com/industry-reports/north-america-financial-advisory-services-market
Zippia. (2023). Finance advisor demographics and statistics in the US.
Retrieved from https://www.zippia.com/finance-advisor-jobs/demographics/
U.S. Bureau of Labor Statistics. (2023). Occupational employment and wage statistics for personal financial advisors.
Retrieved from https://www.bls.gov/oes/current/oes132052.htm


